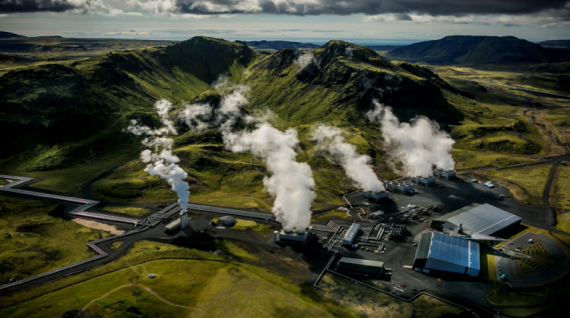
The Hellisheiði Geothermal Power Plant in Hengill, Iceland was the first to inject carbon dioxide into the ground and mineralize it. Photo credit: Sigrg, Wikipedia, (Creative Commons).
Carbon capture and sequestration is a way to trap carbon dioxide before it reaches the atmosphere and contributes to global warming. The carbon dioxide gas is converted into a liquid and then pumped deep into the ground to be buried under thousands of feet of rock. Once underground, the carbon can turn into a mineral, where it can be safely and permanently stored.
The greenhouse effect
When the energy of the sun radiates down to Earth, some of it is absorbed by Earth’s surface while some of it is reflected back into space. Molecules known as greenhouse gases are found in Earth’s atmosphere. These molecules, such as carbon dioxide (CO2), methane (CH4), and nitrous oxide (N2O) trap some of this reflected radiation before it can leave. The layer of greenhouse gases acts much like a blanket, absorbing and trapping heat beneath it that would otherwise escape. This is known as the greenhouse effect.
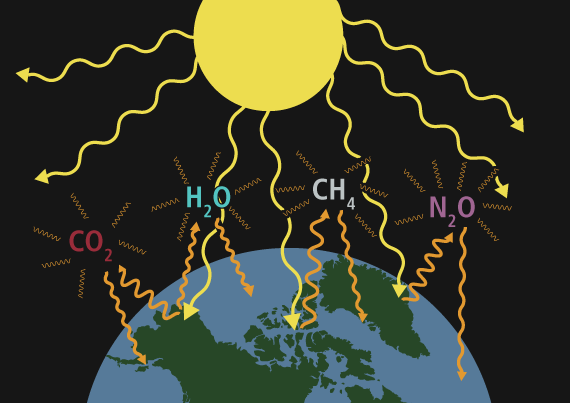
The greenhouse effect. Solar radiation from the sun (yellow arrows) reaches Earth’s surface, warming it.The reflected radiation (thicker orange arrows) can collide with greenhouse gases that re-radiate (thinner orange arrows).
Moderate concentrations of greenhouse gases are good; they keep Earth’s surface from being a cold and harsh environment, like the moon. However, when greenhouse gas concentrations increase, global warming can lead to runaway changes in climate. For example, lighter materials such as snow and ice reflect more sunlight than darker materials such as water and forests. As ice melts due to global warming, more water is exposed, and more plants grow on formerly frozen landscapes. This change allows the earth to absorb more sunlight, leading to even greater global warming.
Human-induced climate change
Human activities have rapidly increased the amount of greenhouse gases in the atmosphere to levels that are higher than at any other point in over 800,000 years. Burning fossil fuels, waste, and wood, and chemical processes such as the manufacture of cement contribute to these large increases in CO2 emissions.
| Since the industrial revolution, the amount of CO2 in the atmosphere has increased by almost 45 percent—from 280 parts per million to 410 parts per million in the last 270 years alone. |
As concentrations of CO2 and other greenhouse gases increase, so does the average temperature of the Earth. According to the World Meteorological Organization, the 20 warmest years on record have occurred in the past 22 years, with the top four being the last four years. These changes have many impacts, including:
- Destroying habitat for wildlife
- Causing species extinction
- Damaging marine, coastal, and terrestrial ecosystems
- Affecting long-term weather patterns
- Melting glaciers
- Raising global sea level
- Acidifying oceans
- Challenging food and water security
- Destroying infrastructure
- Harming economies
CO2 emissions in Washington State
Washingtonians emit nearly 100 million tons of CO2 annually, and CO2 accounts for 81 percent of U. S. greenhouse gas emissions. Total Washington emissions have been relatively consistent since 1990, when the Intergovernmental Panel on Climate Change (IPCC) issued its first report. The top three sources of CO2 are transportation (cars, boats, planes, trains), heating for homes and workplaces, and electricity generation.
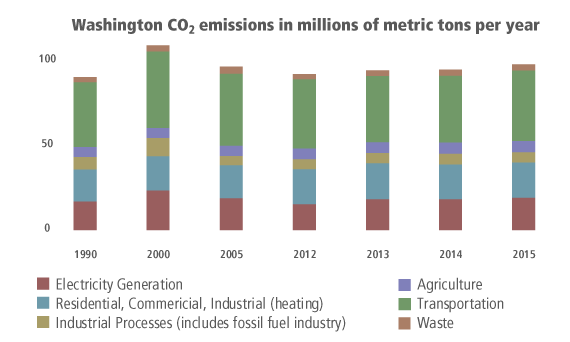
Graph showing Washington State greenhouse gas emissions by type: electricity, heating, industrial processes, transportation, and agriculture and waste (such as trash incineration and sewage processing), and how these changed between 1990 and 2015. Total emissions during this time period were relatively constant at around 96 million metric tons per year.
Point sources
Point sources are fixed structures where CO2 is emitted. Point source emissions account for about half of all Washington CO2 emissions. The remaining emissions come from vehicle tailpipes and are harder to estimate, let alone to physically capture.
Point sources are grouped along the Interstate 5 corridor in western Washington and spread out across the Columbia Basin in eastern Washington.
Point sources include:
- Power plants (coal and natural gas)
- Refineries, chemical productions, oil and gas pipeline transmission
- Paper and pulp mills
- Metal, mineral, and cement production and processing
- Other (waste incinerators, agricultural processing, military, universities, aircraft and technology manufacturing)
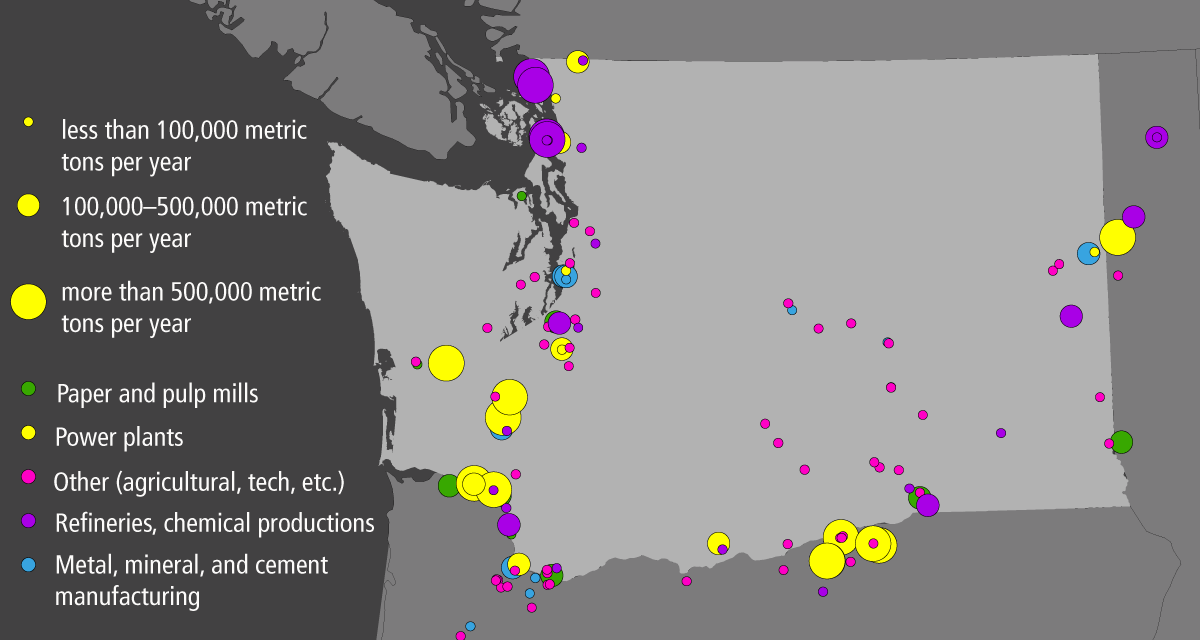
Map of carbon dioxide point sources in Washington State. Larger circles indicate bigger sources of CO2. Data from the Environmental Protection Agency. Click the image to expand it.
Lowering CO2 emissions
To mitigate global warming, the Washington State legislature adopted greenhouse gas (GHG) reduction targets in 2008 as follows:
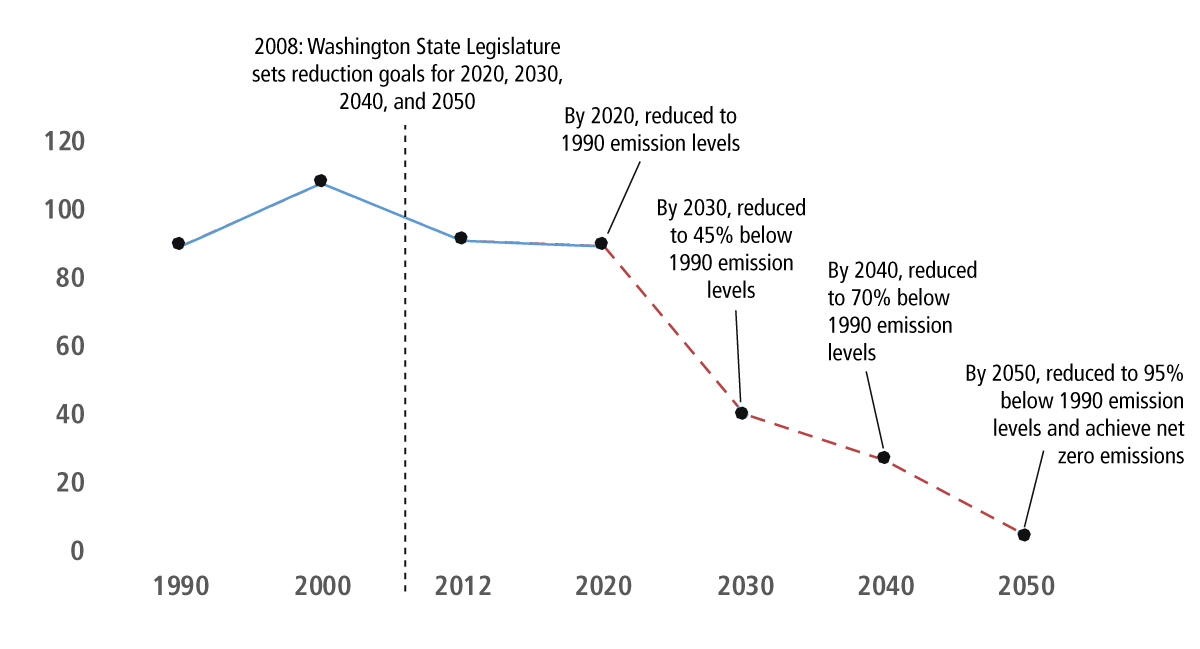
Graph showing total greenhouse gas emissions for Washington State from 1990 to 2020. In 2008, the State Legislature adopted reduction targets for 2020, 2030, 2040, and 2050. The blue line shows past emissions while the red dotted line shows the reduction target emissions for the future. Click the image to expand it.
There are many ways to cut carbon dioxide emissions. Decreasing the use of fossil fuels by switching to renewable energy such as solar, wind, or geothermal plays a significant role in preventing more CO2 from entering the atmosphere. Using less carbon-intensive fuels like natural gas also decreases CO2 emissions. Other energy sources such as hydropower and nuclear emit minimal CO2.
Individuals can also help by reducing their own carbon footprint through everyday choices, such as switching off lights when they’re not in use or commuting by bicycle rather than a gas-fueled car.
Solving the problem is not as simple as stopping our use of fossil fuels. Renewable energy sources such as solar, wind, and geothermal do not yet generate enough energy to help stop the current rate of global warming. There are also challenges to switching to renewable energy. For example, hydroelectric dams impact stream ecosystems. In addition, not every geographic location receives enough wind or solar power, and we don’t yet have the technology to efficiently store and distribute these forms of energy.
Carbon capture and sequestration
One way to help reduce our carbon emissions is to ‘capture’ CO2 and store it underground within rocks. This technique is known as carbon sequestration. It involves collecting CO2 at point sources like smokestacks and then transporting it through pipelines that lead deep underground.
Carbon sequestration is already used by oil and gas companies. They first identify significant point sources of CO2, usually smokestacks from factories or power plants. Engineers then separate the CO2 from the other smokestack gases before sending the pure CO2 to compressors. Compressors squeeze the CO2 until it reaches a state similar to liquid. The pressure from the compressors forces the CO2 to flow through pipelines to the well head where pumps send the CO2 down the well and into reservoir pore spaces in the rock, around 3,000 feet or more below the surface.
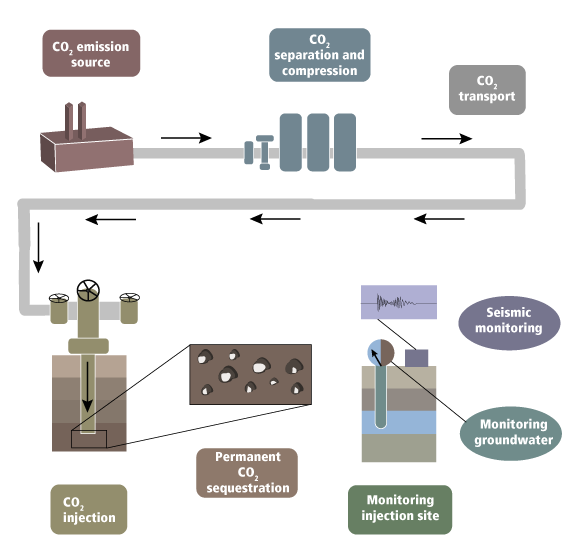
Carbon capture and storage process. Carbon dioxide is emitted from some point source, such as a factory or power plant. It is routed via pipeline to a separation and compression center, where the carbon dioxide is separated from other gases and compressed until it flows like a liquid. The carbon dioxide is then transmitted by pipelines to an injection site, where it is pumped down a well deep underground. The carbon dioxide enters spaces within the rock, and some of it solidifies. The injection site is then monitored to ensure that no gas escapes from anywhere within the well.
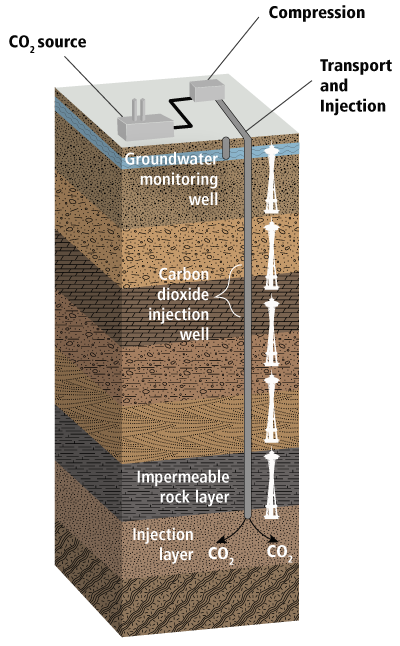
Carbon dioxide injection process. Carbon dioxide is injected via an injection well deep into the Earth, at least 3,000 feet deep (that’s about five Seattle Space Needles!). The carbon dioxide is injected into a rock layer that is porous, with room to store the CO2. There is a rock layer above the injection layer that acts as a seal by not allowing the CO2 to escape.
Permanent carbon storage
Liquids such as water or oil can be pumped into the tiny holes and cracks in a rock formation, but how do we store carbon dioxide gas?
To store CO2 in the pore spaces of large rock layers (reservoirs), CO2 gas is compressed under very high pressure into a liquid-like state and carefully pumped down wells into reservoirs. The wells are sealed with cement and cast iron plugs. The CO2 resides in the pore spaces of the reservoir, where it crystallizes into minerals over the course of several months to a few years. Overlying seal rocks hold back the CO2, preventing it from flowing to the surface or into other rock layers.
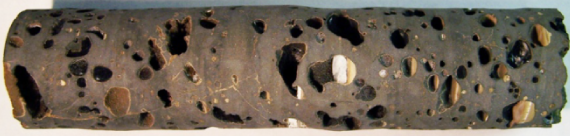
Core plug drilled from Wallula Gap well before injection of carbon dioxide. Some minerals have already formed within the pore spaces from groundwater flowing through. Image from McGrail and Schaef (2015) project report from PNNL to the U. S. DOE.
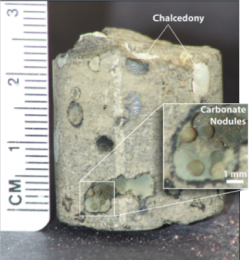
Core plug drilled from Wallula Gap well two years after injection of carbon dioxide. The carbon dioxide has started interacting with the basalt rock to form a mineral known as ankerite. Image from McGrail and Schaef (2015) project report from PNNL to the U. S. DOE.
Sandstone and basalt are typical rock types that are used for storing CO2, and both are common in Washington State. Western Washington hosts conventional sandstone reservoirs while eastern Washington hosts basalt. The basalt, in particular, offers a unique opportunity for sequestration. Studies show that basalt can mineralize CO2 much faster than sandstone—within years instead of tens of thousands of years. The Columbia River Basalt Group consists of extensive ancient lava flows that cover ~210,000 km2 of eastern Washington and parts of Oregon and Idaho. This layer cake of basaltic rock is excellent for CO2 sequestration.
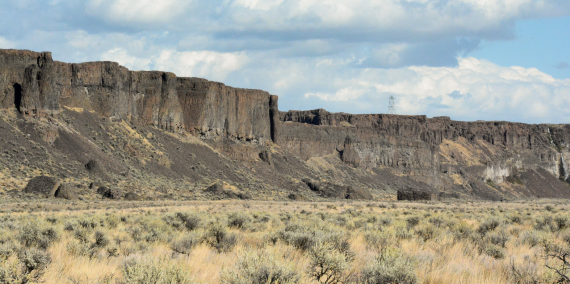
Columbia River Basalt from Frenchman Coulee, Grant County, WA. Photo by Guy McWethy, DNR.
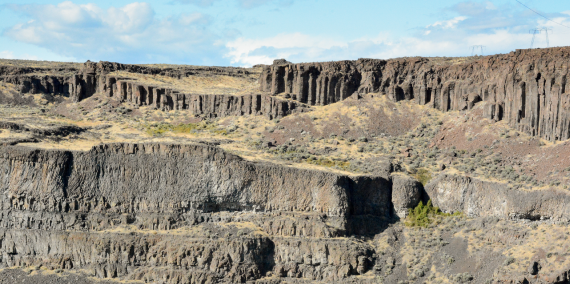
Columbia River Basalt from Frenchman Coulee, Grant County, WA. Photo by Guy McWethy, DNR.
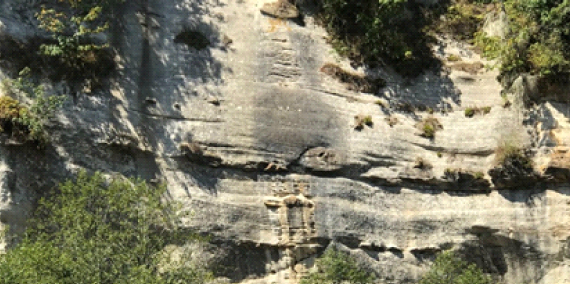
Puget Group sandstone from Green River Canyon, King County, WA. Photo by Will Gallin, DNR.
Carbon Sequestration Risks and Mitigation Strategies
Any engineering solution has inherent risks. Carbon sequestration projects can produce undesired outcomes such as induced seismicity, accidental hydraulic fracture, well underperformance, or CO2 leakage. The National Energy Technology Laboratory can help track and monitor these risks. There is also the potential for putting communities at risk through unfair economic, social, or health consequences. WGS will seek to open dialogue with the public about the risks and benefits of carbon sequestration.
Examples of carbon sequestration projects
Though carbon sequestration has become popular recently, it has been used by the oil and gas industry since the 1970s. The oil industry has been pumping CO2 into geologic formations in a process known as Enhanced Oil Recovery (EOR). EOR is a method where CO2 is injected into rock layers in order to force out any remaining oil trapped in pore spaces. The longest running example of EOR is the SACROC oilfield in west Texas’s Permian Basin.
More recently, CO2 produced from ethanol in Illinois has been captured, transported, and pumped into geologic formations with the possibility of future EOR production. In east Texas, CO2 has been captured from a coal-fired power plant and pumped into geologic formations for EOR production.
Since 1996, Norway has injected one million tonnes of CO2 every year into sandstone sealed by shale beneath the North Sea in the Sleipner gas field. A consortium of American companies has successfully injected over 400 million tonnes of CO2 into limestone in a large west Texas oilfield since 1972.
Wallula Gap
Early experiments have also been done to inject CO2 into the earth for the purposes of long-term storage, rather than oil extraction. In 2009, the Big Sky Regional Carbon Sequestration Partnership drilled a 4,000 foot deep well into Columbia River basalts at Wallula Gap in southeastern Washington. In 2013, the partnership injected 977 tonnes of compressed CO2 into the well over a three week period and monitored the results for three years afterward. Results of the scientific monitoring show that 60 percent of the CO2 crystallized into minerals such as ankerite (similar to dolomite and limestone) within two years of injection. The remaining liquid CO2 is in the process of solidifying. The chemical reactions that turn the CO2 from liquid to solid occur quickly at first, followed by slower reaction rates. Scientists monitoring the Wallula well expected this slowing of reaction rates, but they were pleased by how much of the CO2 solidified within the first two years after injection.

Image of Wallula Gap test well from McGrail and Schaef (2015) project report from PNNL to the U. S. DOE.
The Wallula Gap test well proved that a single well can pump nearly 1,000 tons of CO2 into basalt. The CO2 was captured at a cardboard box manufacturing plant (Boise White Paper, LLC), compressed, and piped to a wellsite. The limited scale of this pilot project, and the enormous quantity of basalt in Washington State, mean that this permanent sequestration process can be dramatically scaled up. If we carefully select, drill, and pump CO2 back into the ground, we can reduce the amount of CO2 that reaches the atmosphere and slow the negative effects of climate change.
Mineralizing CO2 permanently eliminates the risk of gas leaking into the atmosphere. CarbFix, a similar project in basalt CO2 sequestration in Iceland, showed that nearly 100 percent of 175 tonnes of CO2 injected in 2012 mineralized within two years. The Icelandic experiment injected a smaller quantity of CO2 dissolved in water rather than a large quantity of CO2 compressed to a near-liquid state. Although the solidification rate of the Iceland experiment was higher than the Wallula solidification rate, the Iceland experiment required large quantities of fresh water. These two experiments show that it is possible to permanently lock away CO2 on a large scale.
The Wallula Pilot Borehole
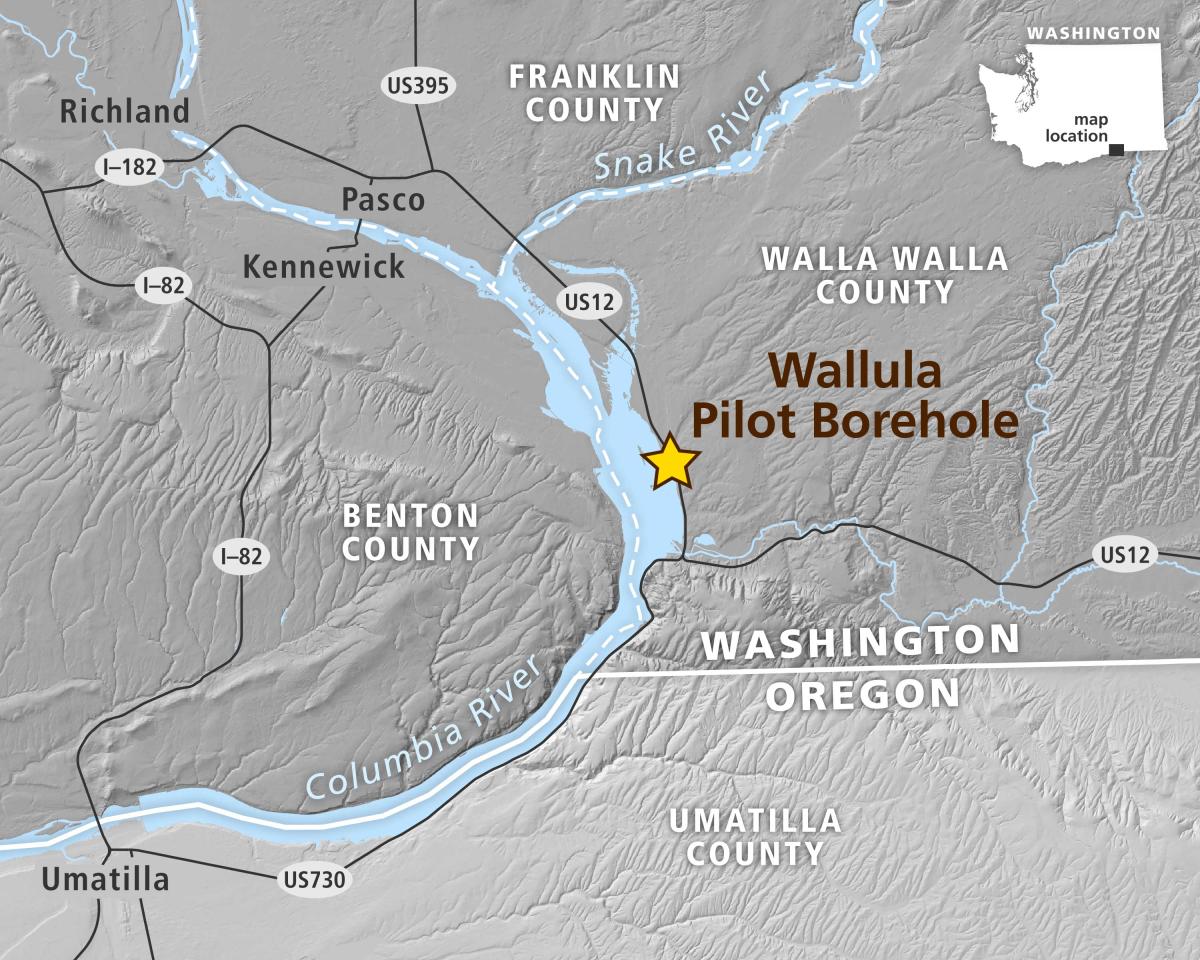
The Wallula pilot borehole is a CO2 injection test well in Walla Walla County, Washington. The test proves the feasibility of injecting CO2 into basalt for permanent mineralization.
Battelle Pacific Northwest Division, the operator of the Pacific Northwest National Laboratory (PNNL), led the project as part of the Big Sky Carbon Sequestration Partnership, which was managed by Montana State University and supported by the U.S. Department of Energy. Boart Longyear provided drilling services from January 14, 2009 to May 19, 2009 on Boise Whitepaper LLC property. The Washington Department of Ecology issued an Underground Injection Permit Class V because the well was drilled before EPA created Class VI. Injection testing consisted of 977 metric tons of supercritical CO2 injected into an upper member (N2) of the Grande Ronde Basalt at a depth of 855 m (2,805 ft bgs) between July 17, 2013 and August 11, 2013. PNNL continued post-injection monitoring and hydrologic testing through 2015.
We provide the following materials that were presented to the Washington Geological Survey by PNNL: geophysical logs (both LAS and image formats), proposed well plan, daily geologist log, daily drilling log, daily activity report, sidewall core description, well location map, and well information document.
Click the links in the table below to download individual files. Click here to download all of the files at once as a single zip file (285 MB file).
| File | Type | Size | Link |
| Location Map | JPG | 19 MB | Download |
| Well Information Sheet | DOC | 27 KB | Download |
| Completed Well Graphic | PNG | 279 KB | Download |
| Geologist Log | 35 MB | Download | |
| Sidewall Cores Description | 21 KB | Download | |
| Daily Drilling Report Part 1 | 100 MB | Download | |
| Daily Drilling Report Part 2 | 114 MB | Download | |
| Log - Elemental Capture Spectroscopy | 2.2 MB | Download | |
| Log - Formation Microimager | 5.3 MB | Download | |
| Log - Platform Express Combination | 1.8 MB | Download | |
| Log - Mechanical Sidewall, Coring Tool, Gamma Ray | 1.5 MB | Download | |
| Log - Reservoir Saturation Tool, Sigma Pass | 200 KB | Download | |
| Log - Sonic Scanner | 2.9 MB | Download | |
| Log - Reservoir Saturation Tool, Sigma Pass, Run 2 | 124 KB | Download | |
| Log - Bond Log, Combination, Run 1 | BMP | 50 MB | Download |
| Log - Bond Log, Combination, Run 2 | BMP | 62 MB | Download |
| Log - Televiewer | BMP | 268 MB | Download |
| LAS File - Formation Microimager | LAS | 1.25 MB | Download |
| LAS File - Platform Express Combination | LAS | 2.42 MB | Download |
| LAS File - Reservoir Saturation Tool | LAS | 932 KB | Download |
| LAS File - Sonic Scanner | LAS | 0.98 MB | Download |
| LAS File - Televiewer | LAS | 203 KB | Download |
| LAS File - Bond Log, Combination, Run 1 | LAS | 164 KB | Download |
| LAS File - Bond Log, Combination, Run 2 | LAS | 405 KB | Download |
The CUSP Project
CUSP stands for Carbon Utilization and Storage Partnership, and it is a project that focuses on the western U.S. The project was spurred by public support for climate change solutions and the economic incentive in the tax code. In 2019, WGS received funding from the DOE in partnership with 18 other partner agencies, forming CUSP. The 18 partners include state geological surveys, national labs, and universities. CUSP seeks the best way to link emission sources to the underground reservoirs in which to store them.
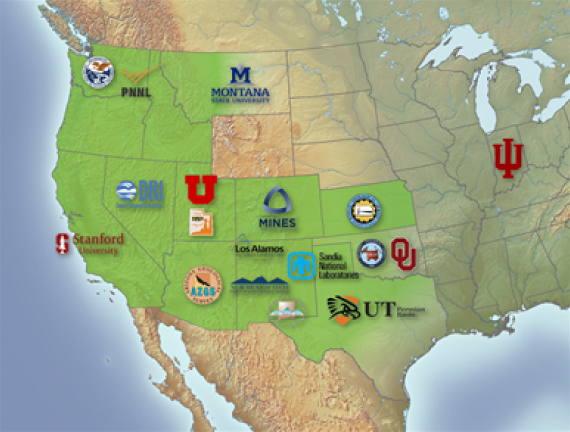
Map showing the CUSP partners
What WGS Does
As a partner in CUSP, WGS shares where we think CO2 should be stored with other CUSP members. To do this, WGS looks at information from hundreds of old, deep wells across Washington State. When these wells were drilled, workers lowered tools down the wells and recorded details about the rocks in the wells on graphs called well logs. WGS uses these graphs to identify good reservoir zones in each well. Then WGS links these reservoir zones together in a three-dimensional connect-the-dots pattern to draw maps showing the best locations and depths to store CO2. WGS gives these maps to CUSP, and CUSP connects our maps of the best reservoir zones to other maps we help them collect, like maps of emissions sources, pipelines, railways, roadways, and social impact maps that show where people live and how projects might affect them. The resulting combination of maps will give the public, the government, and industry the facts they need to choose the best way to store CO2 underground and help meet our goal of reducing CO2 in the atmosphere.